Inventory
All modules
View stock moves and reports
Inventory · 11 of 14 · 4 min read
The Stock Moves history lists every product movement: those from transfers and those from scraps. Inventory Reports summarises on-hand quantities, movements, incoming and outgoing goods, turnover, and scraps. For example, use them to trace where a product has been, check what still needs to come in or go out, and see how much stock has been scrapped and for what reason.
Which screen to use
The two screens are in the Inventory menu and serve different purposes.
- If you are looking for a single movement — for example all moves for the LED desk lamp or those belonging to WH/OUT/00003 — open Inventory › Stock Moves.
- If you need an overview by product or by location, or the total scraps by reason, open Inventory › Reports.
The movement history is read-only: nothing is created or edited here. Movements originate from transfers and scraps.
Viewing the movement history
The history shows the movements of all transfers, starting from the most recent. You can narrow it down using search and filters.
- Open Inventory › Stock Moves.
- Type a product name or a transfer reference in the Search product, move, or picking... field — for example
WH/IN/00002. - Use the filters to narrow the list.
- To return to the full list, click Clear filters.
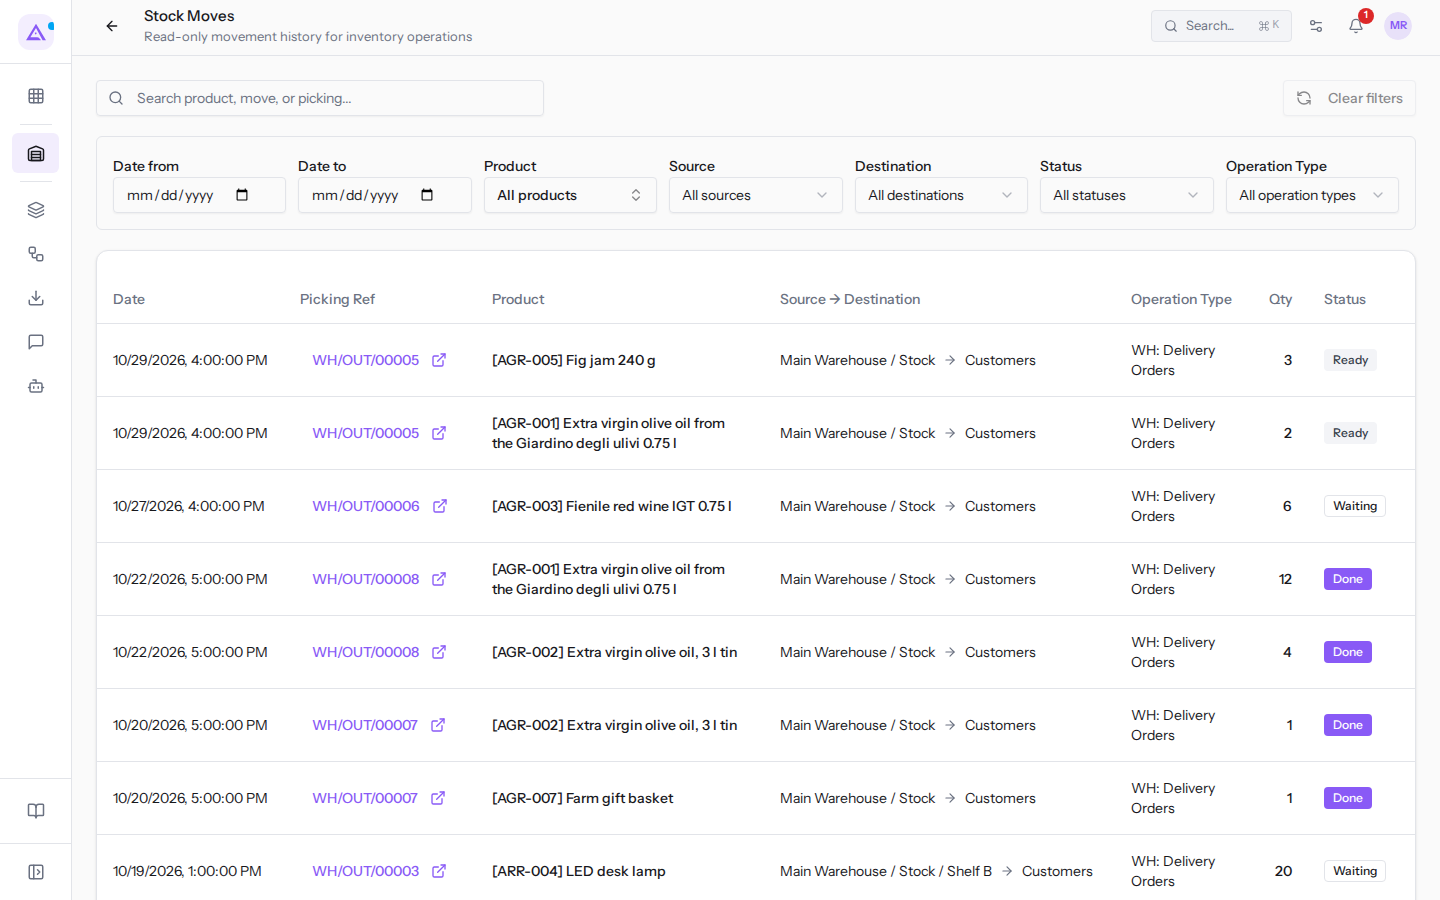
The filters on this screen are:
- Date from and Date to: limit the list to movements between the two dates. You can fill in just one of them.
- Product: shows only the movements of one product. The default value is All products.
- Source: shows only movements that originate from a location. The default value is All sources.
- Destination: shows only movements that arrive at a location. The default value is All destinations.
- Status: the default value is All statuses. The options are:
- Draft
- Waiting
- Partially Available
- Ready
- Done
- Cancelled
- Operation Type: the default value is All operation types. The options are the warehouse operation types, for example WH: Receipts, WH: Delivery Orders and WH: Internal Transfers.
The columns in the list are:
- Date: the date of the movement.
- Picking Ref: the transfer to which the movement belongs, for example
WH/OUT/00003orWH/INT/00001. For a scrap the column is empty. - Product: the product that was moved.
- Source -> Destination: the location from which the goods depart and the one where they arrive.
- Operation Type: the type of the transfer, for example WH: Delivery Orders.
- Qty: the quantity moved.
- Status: the status of the movement. Only Done movements have already updated the on-hand quantity.
Opening the inventory report
The report collects stock analyses across five tabs.
The Reports entry is only visible to users who have the Inventory Manager permission.
- Open Inventory › Reports.
- Set the period using the From and To fields.
- Choose a tab: By Location, Moves, Forecast, Turnover, or Scrap by reason.
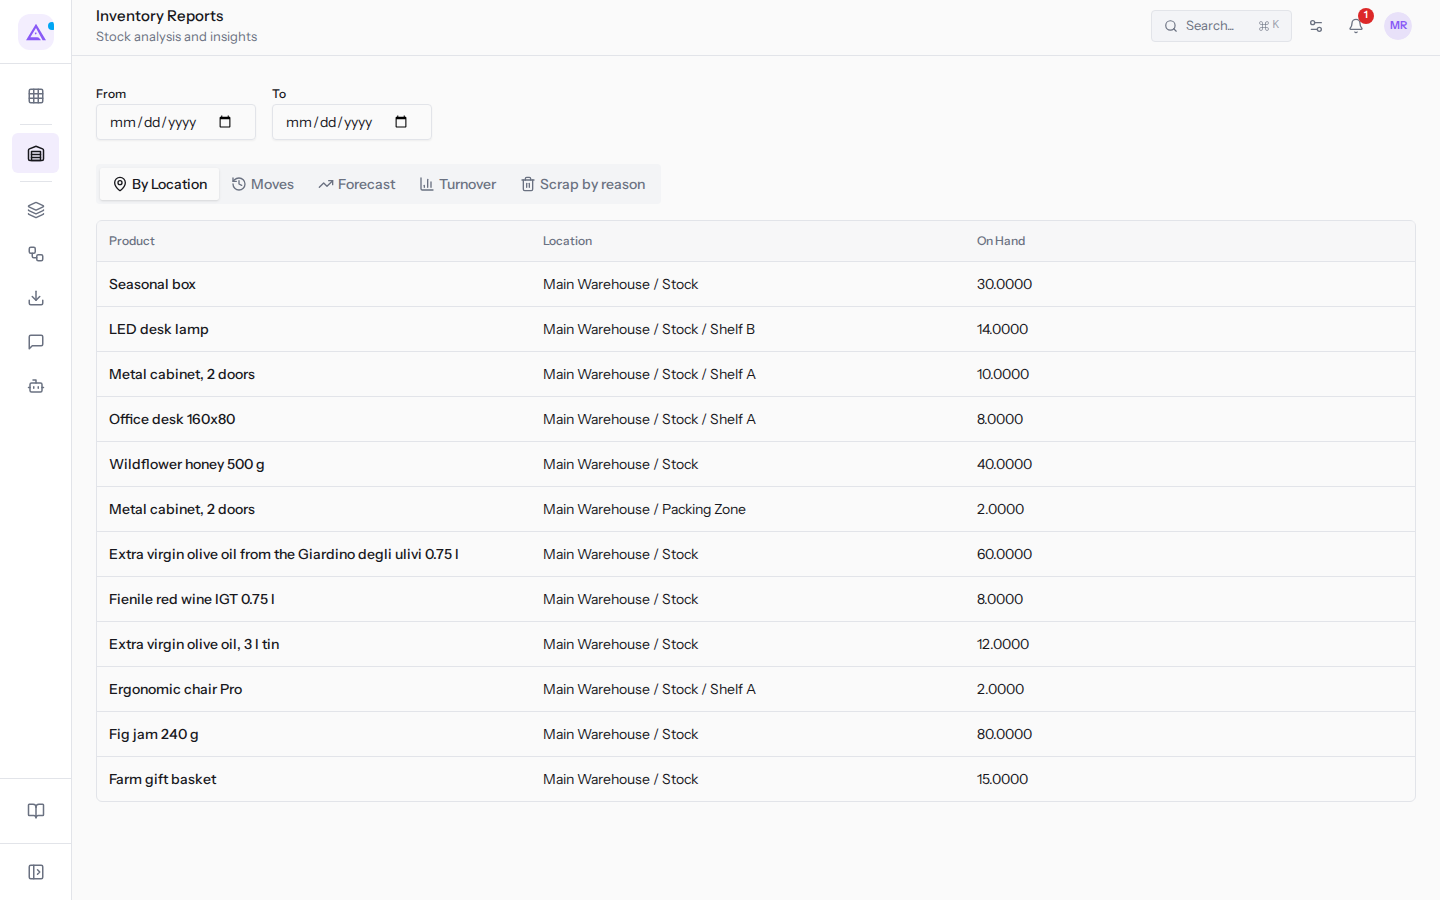
By Location tab
The tab shows the available quantity of each product in each location. For example, the Office desk 160x80 on Shelf A.
The columns are Product, Location, and On Hand.
Moves tab
The tab lists movements with the transfer, the product, and the locations. For example, WH/OUT/00003 with the LED desk lamp.
The columns are Reference, Product, From, To, and Qty.
Forecast tab
The tab compares, for each product, the available quantity against the quantity that still needs to come in or go out. Use it to understand which products are about to run out: for example the LED desk lamp has 14 units on hand and 20 outgoing with delivery WH/OUT/00003, so the forecast is -6. Where there is nothing incoming or outgoing the tab shows +0 and -0.
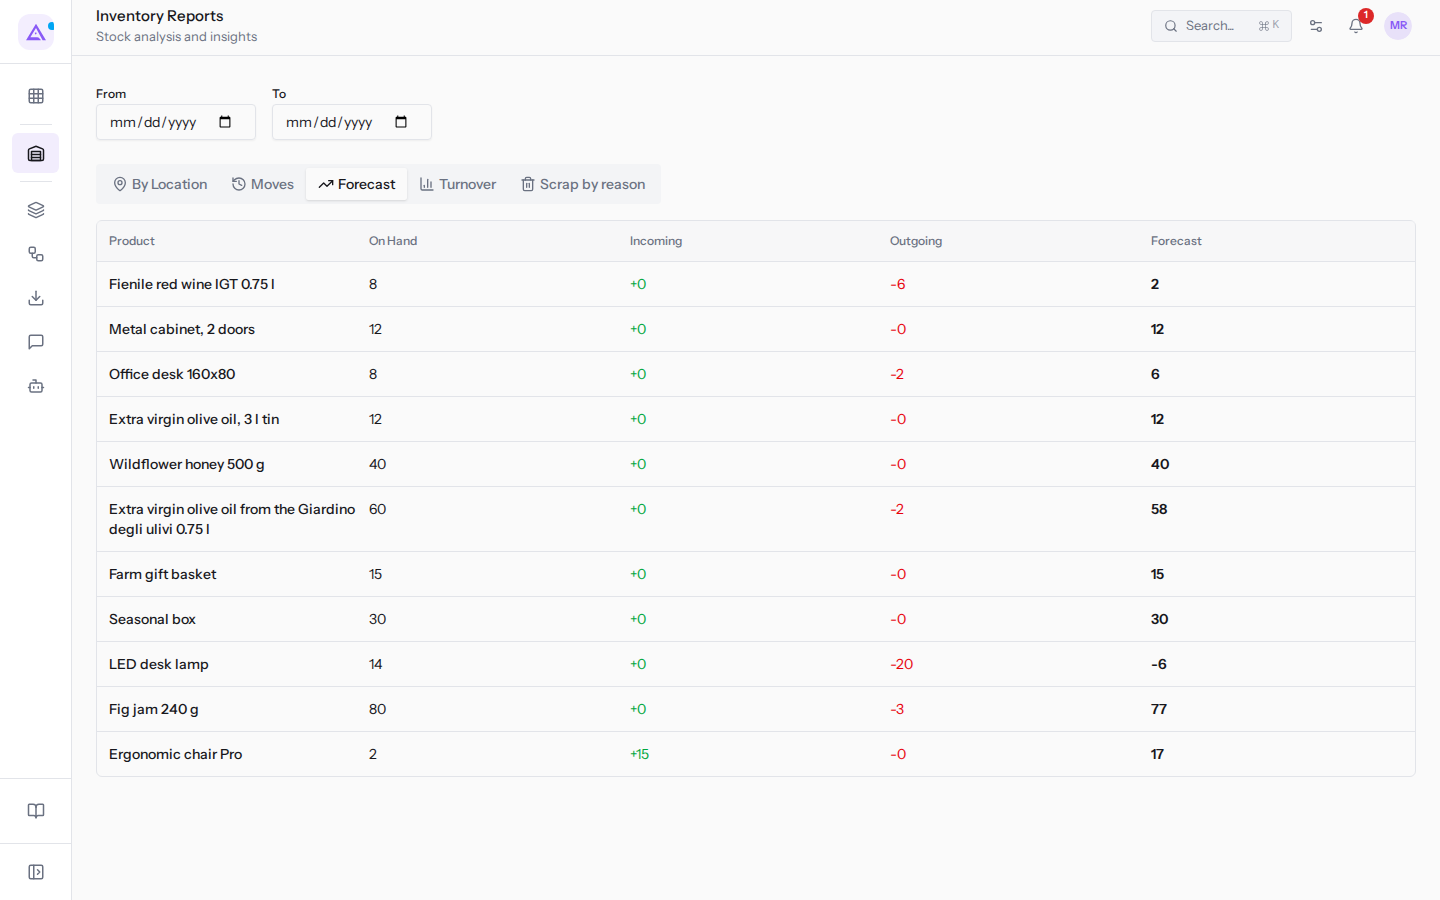
The columns are:
- Product: the product.
- On Hand: the available quantity.
- Incoming: the quantity expected from incoming transfers.
- Outgoing: the quantity expected from outgoing transfers.
- Forecast: the forecasted quantity for the product.
Turnover tab
The tab shows how quickly stock leaves the warehouse for each product. For example, the Ergonomic chair Pro.
The columns are:
- Product: the product.
- Qty Out: the quantity that has left the warehouse.
- Avg On Hand: the average on-hand quantity.
- Turnover: the turnover rate for the product.
Scrap by reason tab
The tab groups scraps by reason, showing the value and quantity for each reason. For example, Breakage with €18.50 and quantity 1, corresponding to scrap SP/00001 of one LED desk lamp.
- Open the Scrap by reason tab.
- In the Reason field leave All reasons or choose a single reason.
- To download the data, click Export CSV.
See it on your company, not on a slide deck.
In 30 minutes we map the software you use today.We show you how much work and how much margin Archimedes gives back.
Show me on my business →What industry are you in?
One tap — it lets us prepare the demo around your world.
What tools do you use today?
Pick the ones you recognise — or just type them. It helps us show you how they migrate.
Last step: your details.
We reply within one working day — and right after, if you like, you pick the demo slot yourself.
We couldn't send your request. Try again, or write to us at [email protected].
By sending, you agree to your data being processed so we can get back to you about the demo. Privacy notice.
Preview form — nothing is sent from this page.
Want to schedule the demo now?
Your call: book the slot you prefer yourself, or we'll call you to arrange it.
Live availability, 30 minutes, instant confirmation. The calendar opens in a new tab.
Lock in your slot ↗We'll get back to you within one working day — and we'll join the call already knowing your world.
The calendar is open in another tab: pick a slot and the demo is booked. Can't see it? Reopen it ↗
Preview page: nothing was sent.
Our calendar is live: take the slot that suits you and the demo is booked. 30 minutes, instant confirmation, no waiting.
Lock in your slot ↗