Projects
All modules
Analyze projects with reports
Projects · 14 of 17 · 6 min read
The Project Reports page brings together project and team hours analysis in one place. Use it to see, for example, which projects have exceeded budget, how many hours each person has logged, or how long a project stays in each phase.
Note: the Projects › Reports menu item is visible only to the Project Manager group.
Open reports and choose the period
Reports are viewed over a period you select at the top of the page.
- Open Projects › Reports.
- Fill in From and To with the start and end dates of the period.
- Click the report tab you need: Portfolio, Hours by Person, Velocity, Hours by Order, Time per Phase, Money, or Committed Work.
Page fields:
- From: the start date of the analysed period. The field is not required.
- To: the end date of the analysed period. The field is not required.
Choose the tab based on your question:
- To see which projects are ahead, behind, or over budget, open Portfolio.
- To see who has logged how many hours, open Hours by Person or Hours by Order.
- To see how much work is being closed over time, open Velocity.
- To see where projects stall, open Time per Phase.
- To see how much has been invoiced and earned, open Money.
- To see how much work remains, open Committed Work.
Portfolio
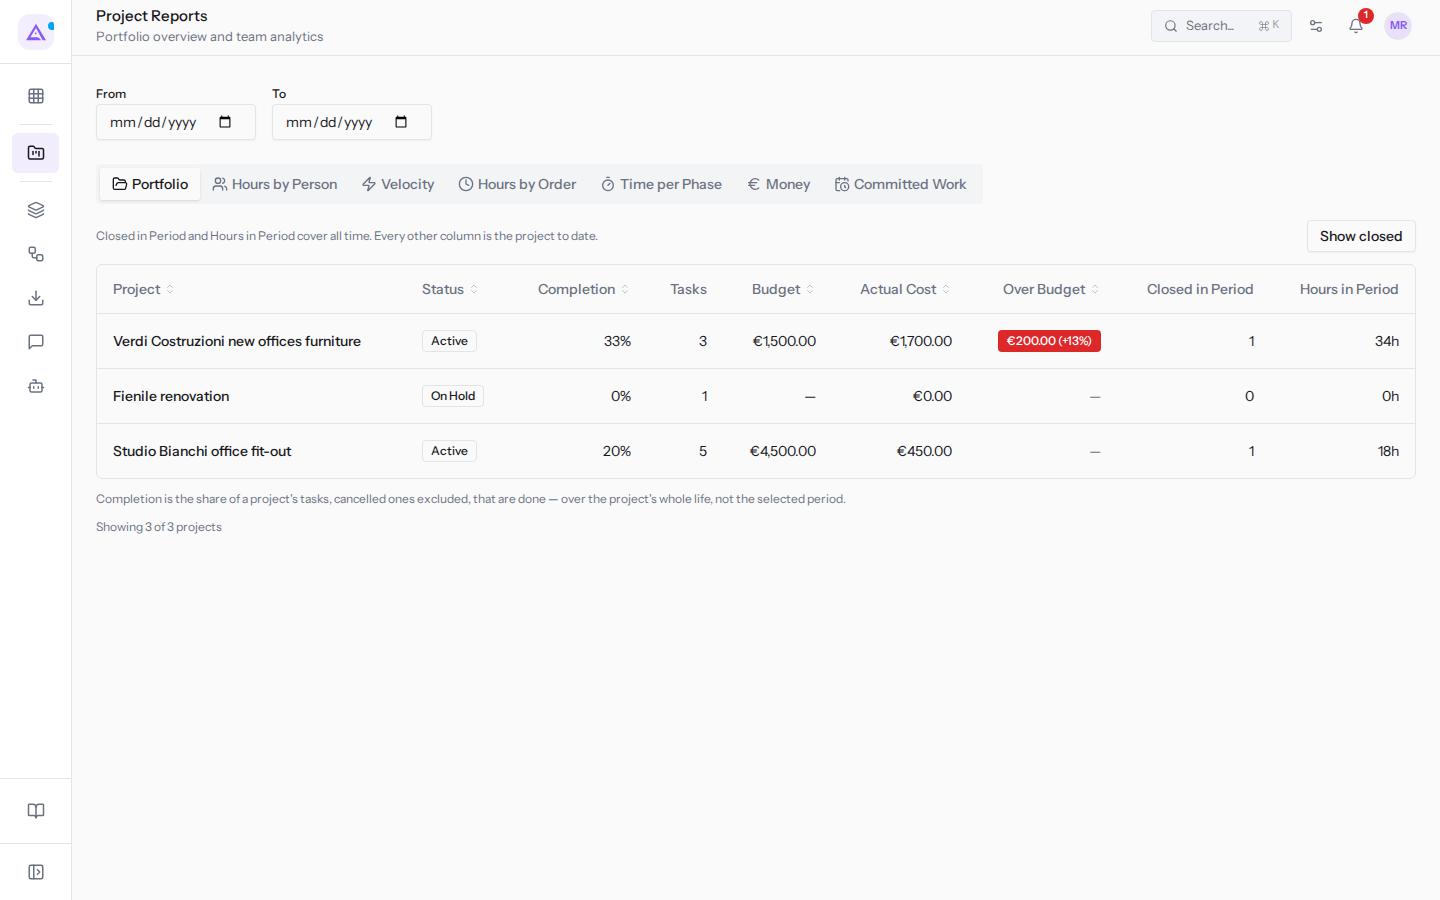
The Portfolio tab lists projects with their progress status and a comparison of budget versus cost. It answers the question: which projects are exceeding their budget?
Table columns:
- Project: the project name.
- Status: the project status.
- Completion: the share of the project's tasks that are done, excluding cancelled ones. The value covers the entire life of the project, not the selected period.
- Budget: the project budget.
- Actual Cost: the cost logged on the project.
- Tasks: the number of tasks in the project.
- Over Budget: how much the cost exceeds the budget. Verdi Costruzioni new offices furniture, for example, is over by €200.00 (+13%).
- Closed in Period and Hours in Period: these are the only columns that refer to the period chosen in From and To. All other columns cover the project from the beginning.
Press Show closed to add completed and cancelled projects to the list, which otherwise do not appear.
Note: a project can show as over budget even if it has no hours in the selected period, because Budget and Actual Cost cover the entire life of the project.
Budget and cost can also be set and viewed in the project page.
Hours by Person
The Hours by Person tab shows hours logged by people, by person and by month. It answers the question: how many hours has each person logged in the months of the period? Mario Rossi, for example, has 34h and Giulia Verdi 56h.
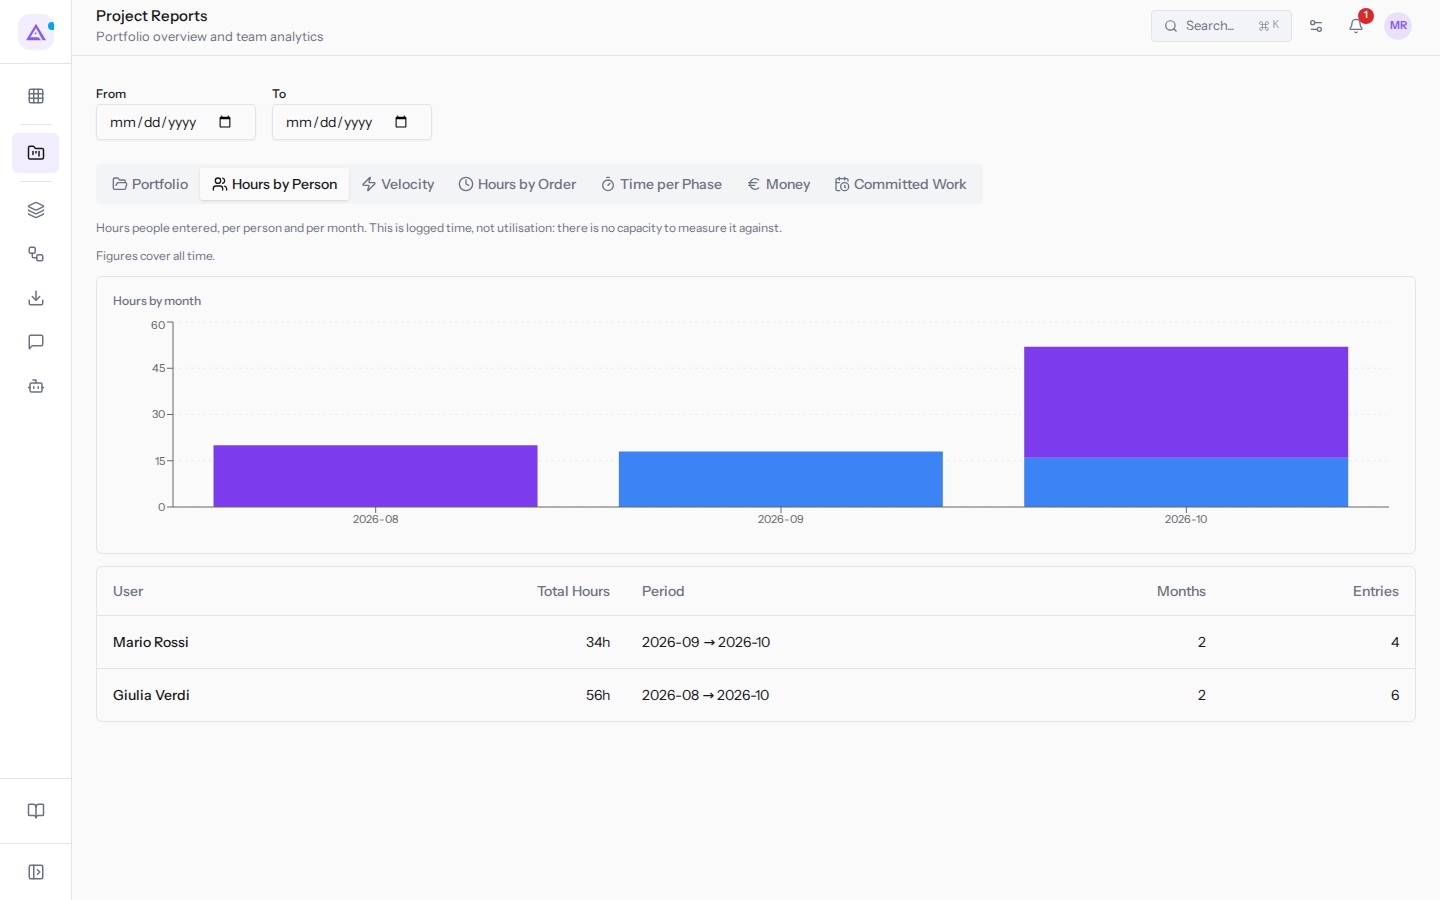
Important: these are logged hours, not a utilisation rate. The report does not compare them against a capacity.
Velocity
The Velocity tab shows how many tasks are completed in each period. It answers the question: is the team closing more or less work compared to previous periods?
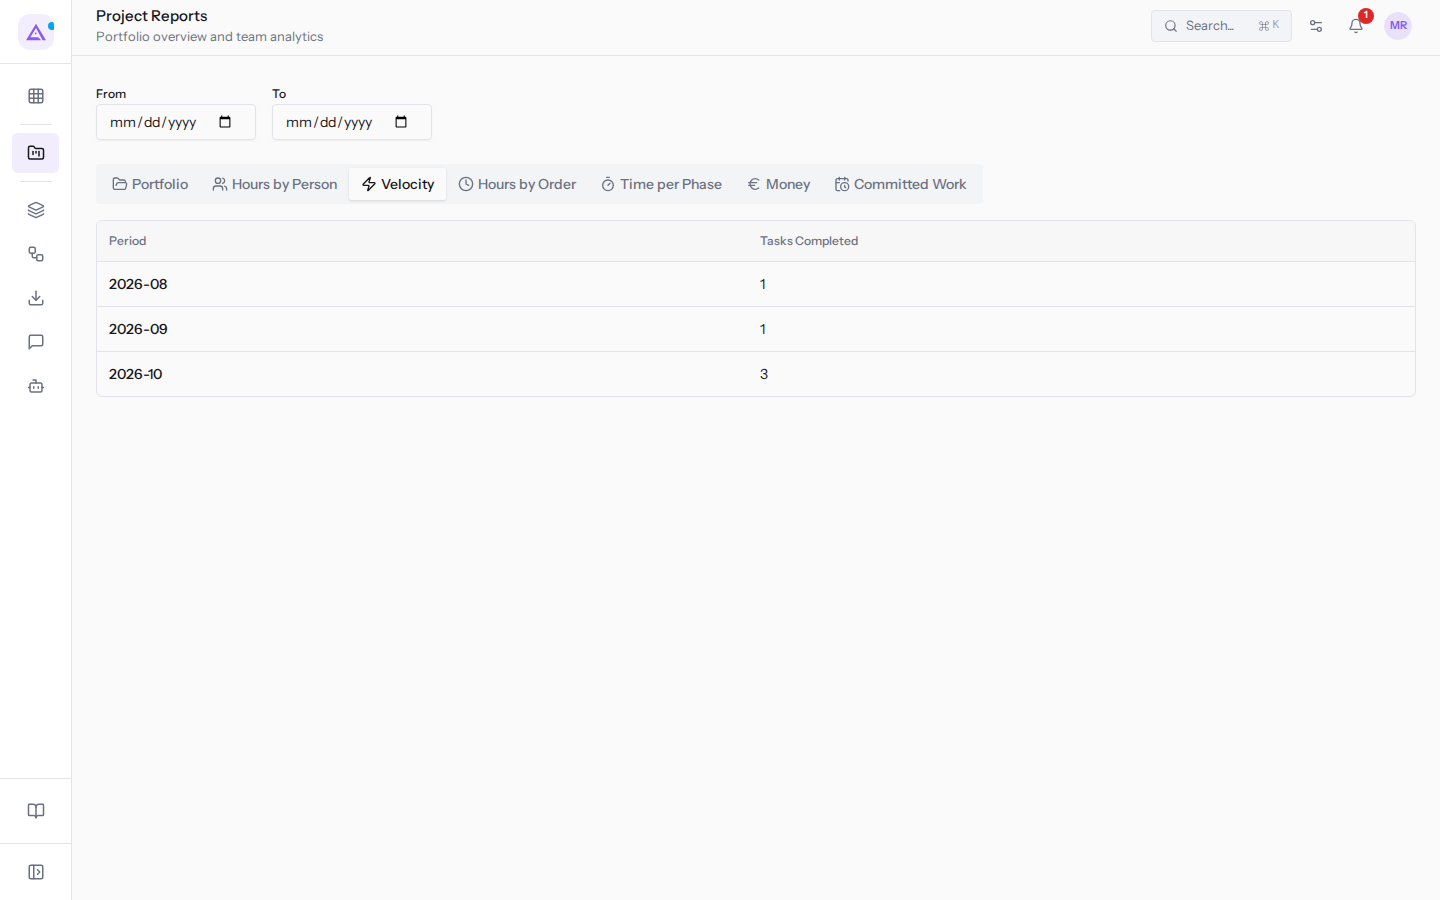
Table columns:
- Period: the reference period.
- Tasks Completed: the number of tasks completed in the period.
Note: tasks completed without a completion date are not counted in any period. The report shows how many there are.
Hours by Order
The Hours by Order tab shows hours logged on each project and the same hours broken down by the person who logged them. It answers the question: which projects did the team's time go to, and who logged it?
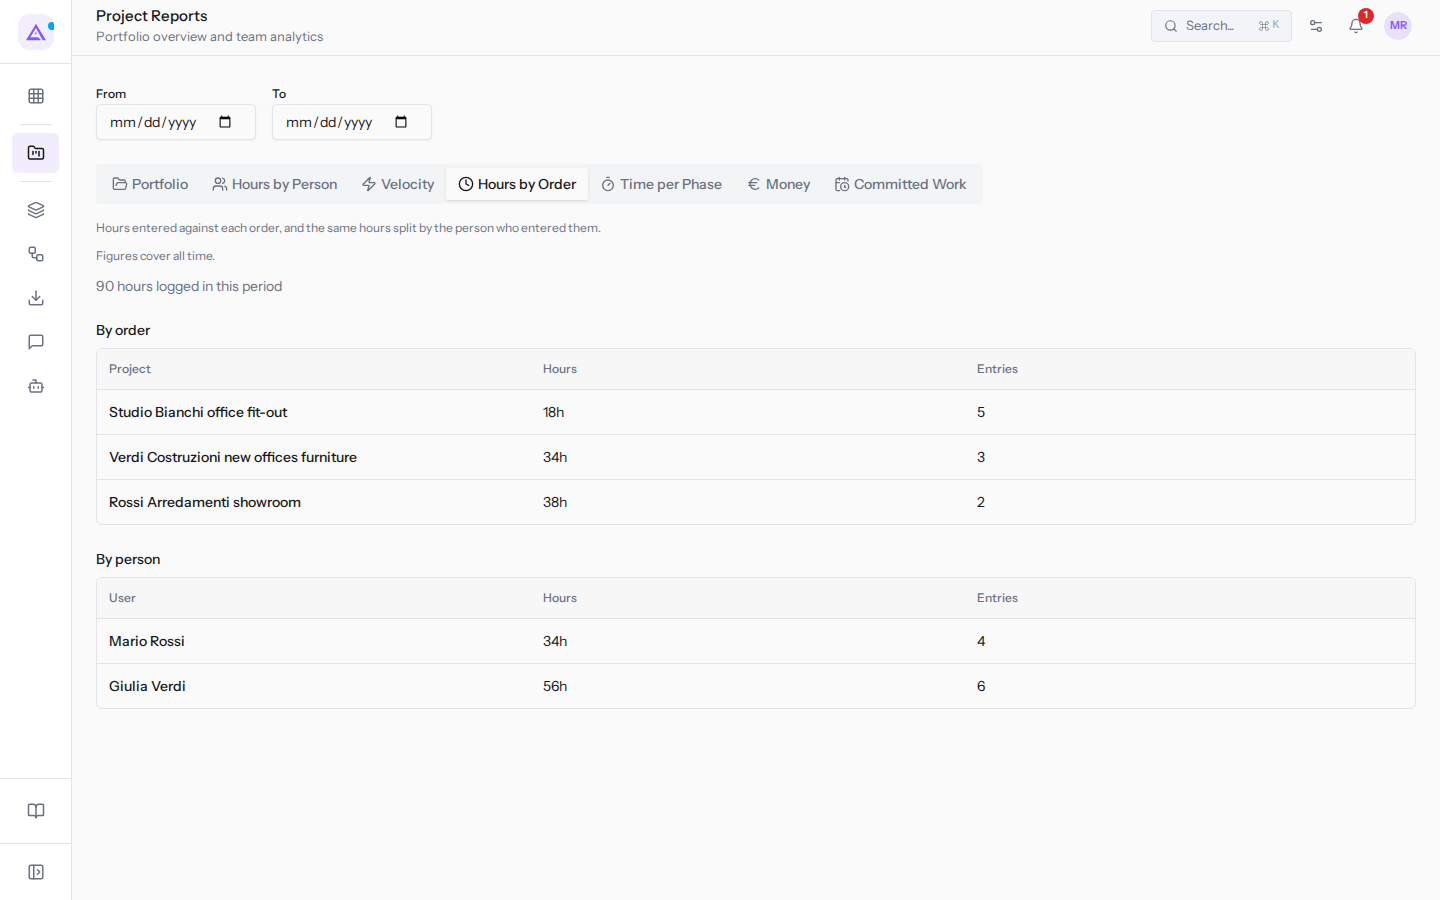
The tab has two sections:
- By order: the total hours for each project.
- By person: the total hours for each person, for example 34h for Mario Rossi and 56h for Giulia Verdi.
Time per Phase
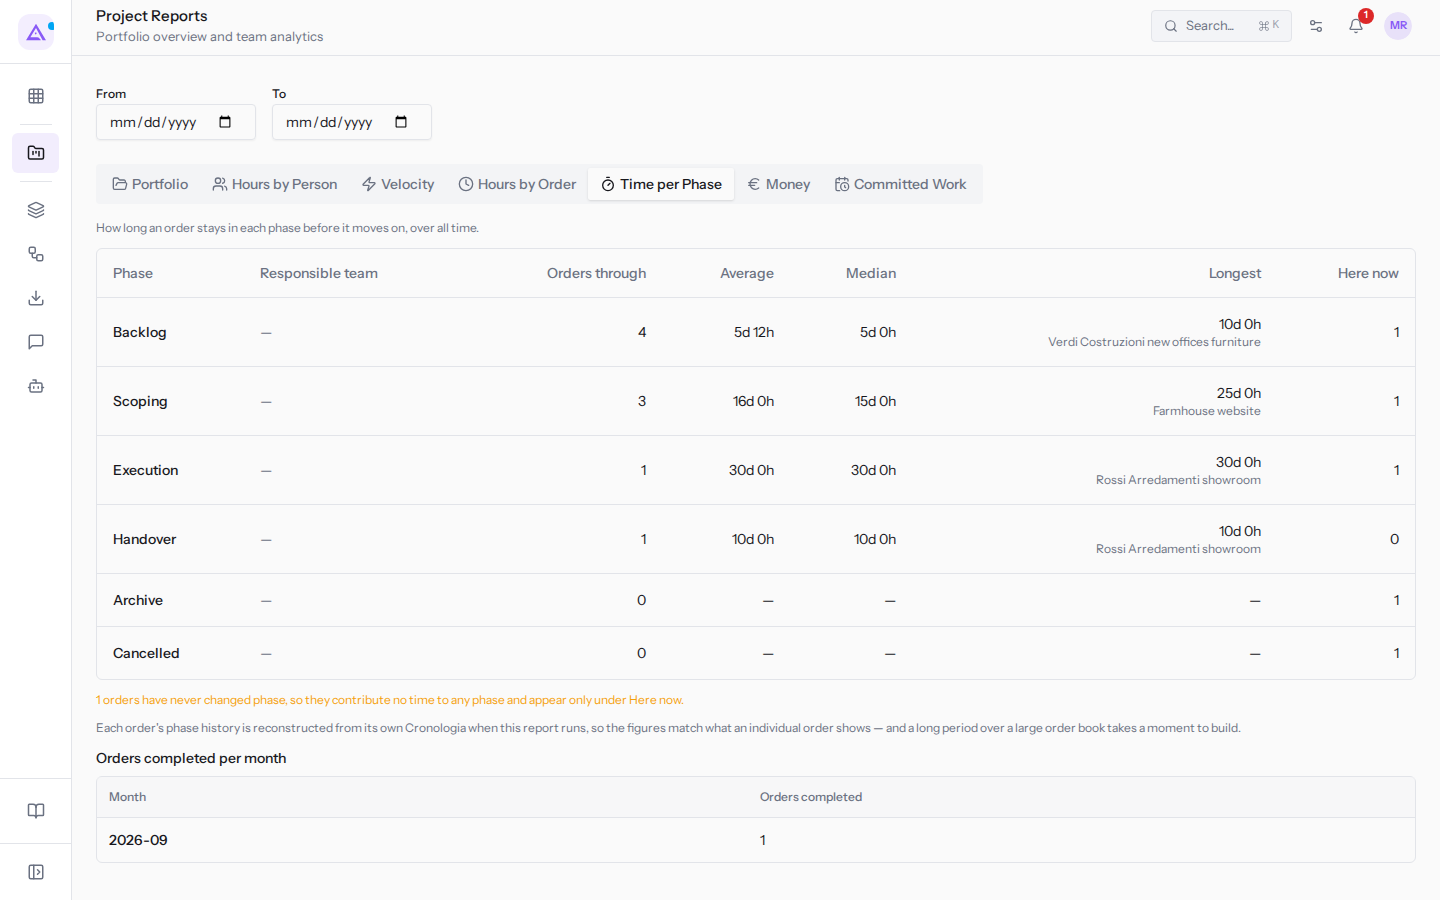
The Time per Phase tab shows how long a project stays in each phase before moving to the next, in the selected period. It answers the question: in which phase do projects stay longest? The Longest column also shows which project: Rossi Arredamenti showroom, for example, stayed 30 days in Execution and 10 in Handover.
How it is calculated:
- The phase history of each project is reconstructed from its timeline at the time of calculation. The figures therefore match those on the individual project page.
- A long period across many projects takes a moment to calculate.
- Projects that have never changed phase do not contribute to any phase's time. They appear only under Here now.
Money
The Money tab shows invoiced, collected, and profit figures for the projects you can see, in the selected period. It answers the question: how much do the projects earn?
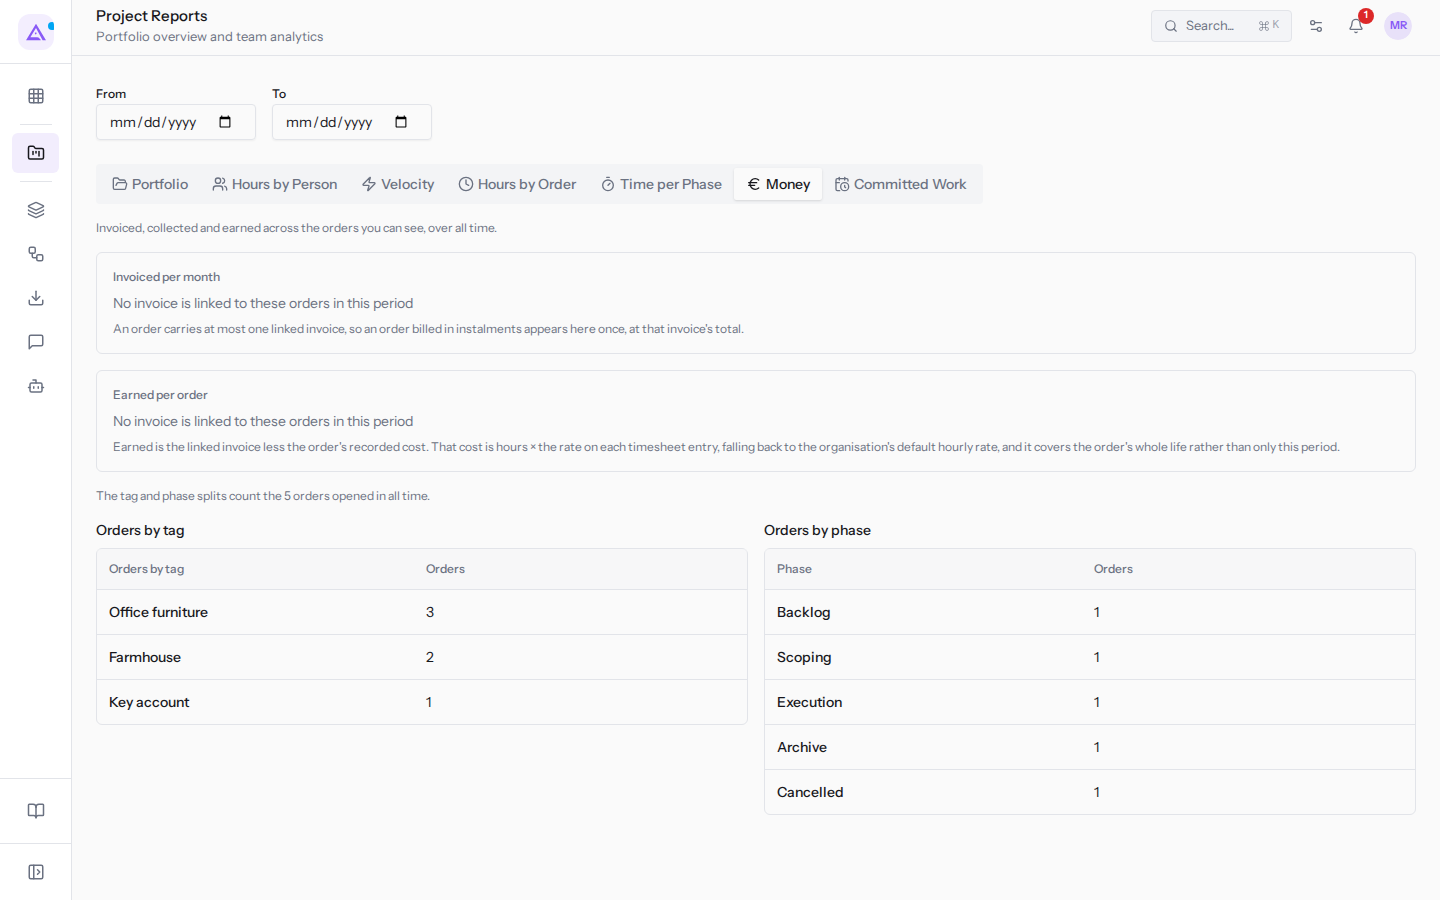
The tab has two breakdowns:
- Orders by tag: how many orders each project tag has.
- Orders by phase: how many orders are in each phase.
Both breakdowns count the projects open in the selected period.
How profit is calculated:
- Profit is the invoice linked to the project minus the project's logged cost.
- Cost is given by hours multiplied by the rate of each entry. If an entry has no rate, the organisation's default hourly rate is used.
- Cost covers the entire life of the project, not just the selected period.
Note: a project can have at most one linked invoice. A project billed in instalments appears only once, with the total of that invoice.
Committed Work
The Committed Work tab shows the planned hours yet to be completed on open tasks. It answers the question: how much work remains, by person and by team?
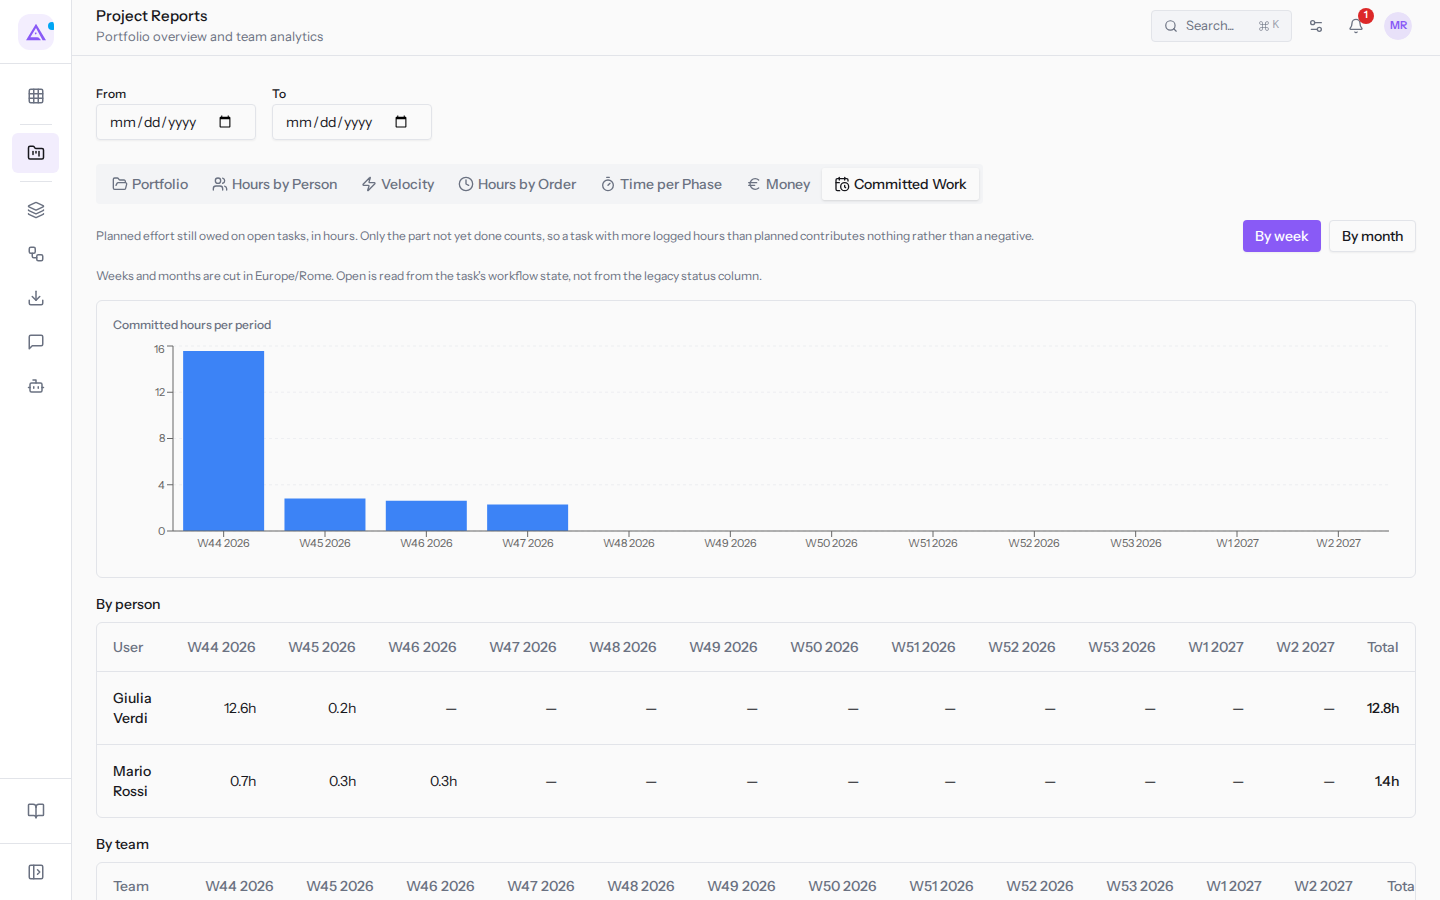
- Choose By week or By month to group hours by period.
- Read the hours in the By person and By team sections.
How it is calculated:
- Only the not-yet-completed portion is counted. A task with more logged hours than planned hours does not contribute, rather than producing a negative value.
- A task with multiple assignees divides the remaining hours equally among them. The per-person rows therefore add up to the work that actually exists.
- Work without dates does not fall into any period, and work without an assignee does not fall into any person's row. The report shows how many hours are left out.
- Team data requires that phases indicate a responsible team. If no phase does, all hours fall under 'No team assigned'.
See it on your company, not on a slide deck.
In 30 minutes we map the software you use today.We show you how much work and how much margin Archimedes gives back.
Show me on my business →What industry are you in?
One tap — it lets us prepare the demo around your world.
What tools do you use today?
Pick the ones you recognise — or just type them. It helps us show you how they migrate.
Last step: your details.
We reply within one working day — and right after, if you like, you pick the demo slot yourself.
We couldn't send your request. Try again, or write to us at [email protected].
By sending, you agree to your data being processed so we can get back to you about the demo. Privacy notice.
Preview form — nothing is sent from this page.
Want to schedule the demo now?
Your call: book the slot you prefer yourself, or we'll call you to arrange it.
Live availability, 30 minutes, instant confirmation. The calendar opens in a new tab.
Lock in your slot ↗We'll get back to you within one working day — and we'll join the call already knowing your world.
The calendar is open in another tab: pick a slot and the demo is booked. Can't see it? Reopen it ↗
Preview page: nothing was sent.
Our calendar is live: take the slot that suits you and the demo is booked. 30 minutes, instant confirmation, no waiting.
Lock in your slot ↗